03 · Ferry and cruise
CruiseCommerce. Provisions planned for each sailing.
The right provisions for each sailing, less food thrown away and lower stock costs. CruiseCommerce records every sale by item, time, outlet and sailing, and proposes what to stock for the next one.
Deck 7 · sea day
One stock plan for all sailings
Before a sailing, the store is filled to the same par levels as last time.
The roster is copied too. If the sailing turns out quieter, fresh food ends up in the bin, and if it is busier, the best sellers run out.
Ferry
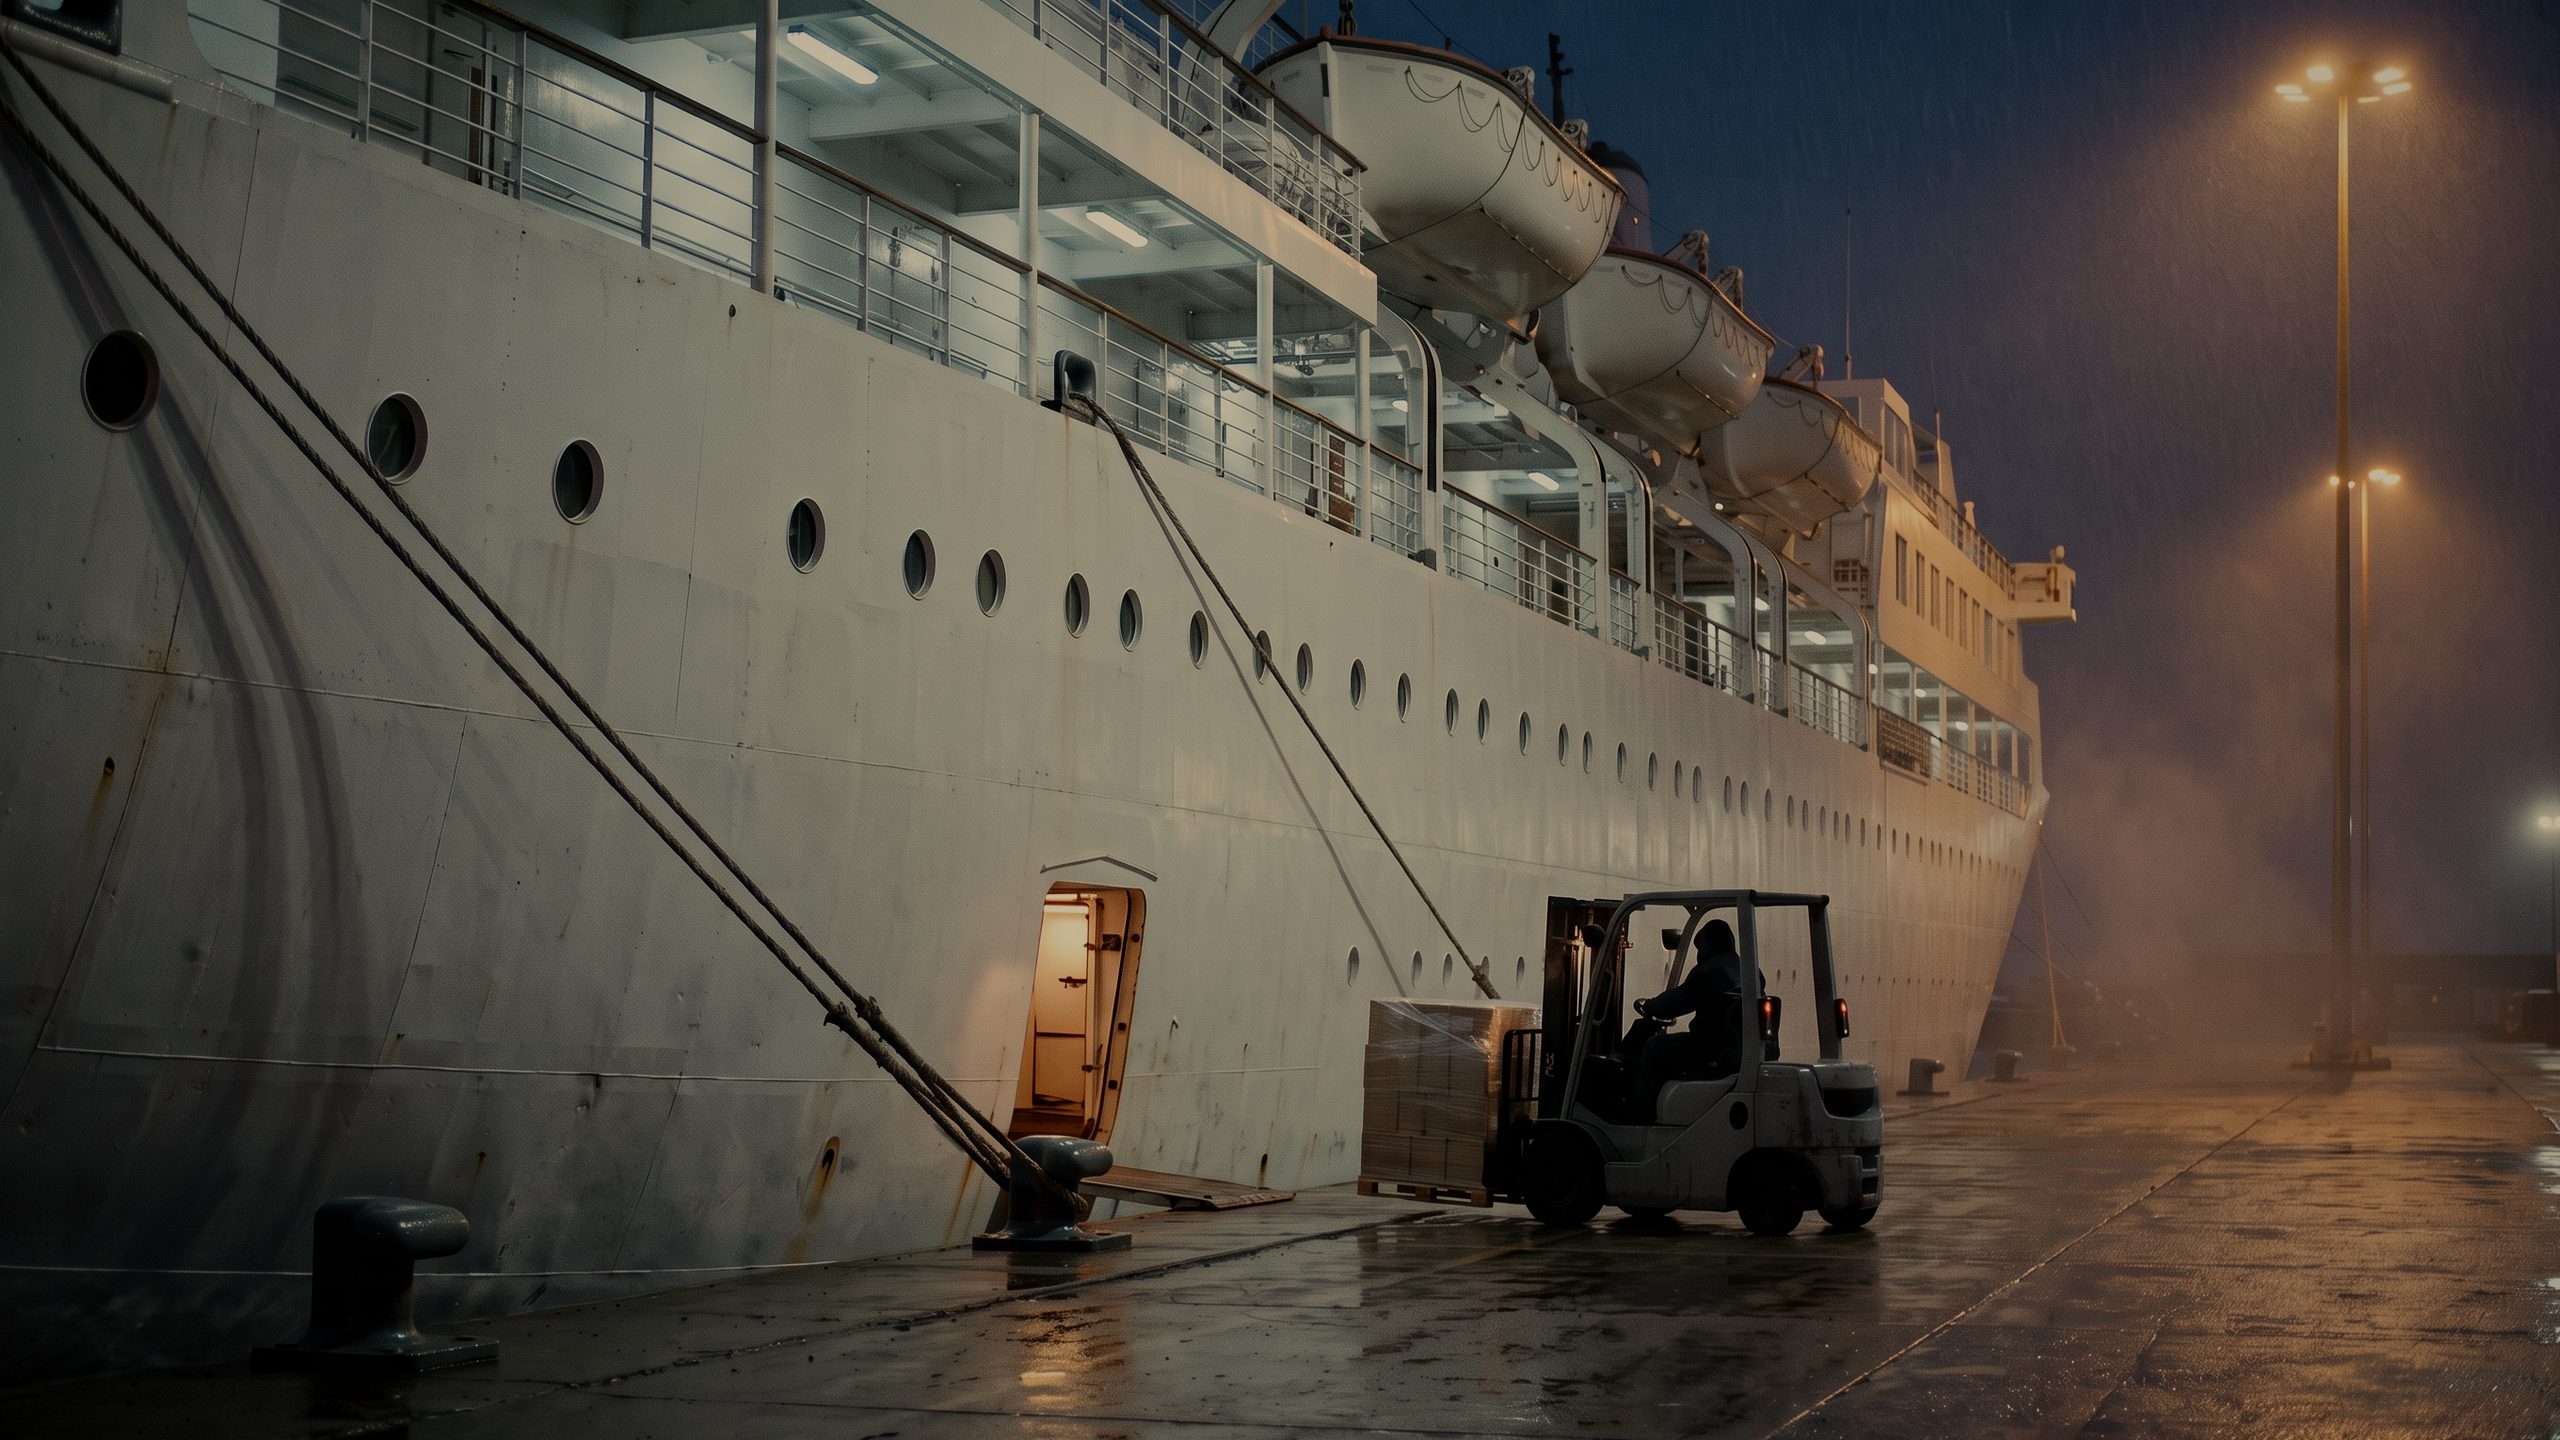
On a ferry you only sell during the crossing, so anything that runs out halfway stays out until you dock.
Industry data: One large Baltic ferry company made 48% of its 2025 revenue from restaurants and shops on board and ashore, and 29% from tickets (Tallink Grupp, 2026).1
Cruise
On a cruise, the galley feeds guests and crew for the whole voyage, and any buffer left in the store is food you have already paid for.
Industry data: The largest cruise group spent just under USD 1.5 billion on food for guests and crew in its 2025 financial year, about 83% of what it spent on fuel (Carnival Corporation & plc, 2025).2
What you gain
Fewer empty shelves
Your sales records show which outlet ran out of what, and when.
Lower stock costs
Stock follows what similar sailings used, not a fixed par level.
Less food thrown away
CruiseCommerce compares what the galley cooks with what gets eaten.
Crew where the queue is
Demand by deck shows where your roster leaves a queue.
What the software shows
Crossing · Sat sailings · 8 weeksVoyage 12 · sea days and port days · 6 voyages
Crossing · Sat sailings · 8 weeks
- Bar, deck 7, Queue in the first 30 minutes, Roster short
- Café, Idle in the last hour before arrival, Marked on roster
- Shop, Crisps rarely sold on evening sailings, Slow seller stays ashore
- Shop, Chocolate sold out before arrival, Best seller doubled
- Before
- Proposal
- Staffing
- Queue
- Idle
- Gap removed
- leastmost
- Peak expected
- Slow seller stays ashore
- Best seller doubled
- revenue per staff hour by outlet ↑
- stock per sailing ↓
The strips show demand at each outlet after departure, with staffing drawn above them. That is where the queue at the bar and the idle time in the café show up.
Voyage 12 · sea days and port days · 6 voyages
- Sea day
- Port day
- Port day
- Sea day
- Sea day
- Port day
- Sea day
- Deck 7, Bar busy on sea-day afternoons, Roster short
- Port day, Café busy, bars quiet, Marked on roster
- Provisions store, Fruit buffer above forecast, Load less
- Galley, More scrambled eggs cooked than eaten, Prepare less
- Sea day
- Port day
- leastmost
- Peak expected
- Before
- Proposal
- Forecast
- Range
- Buffer
- Order cut-off −24 h
- Produced
- Eaten
- Gap removed
- stock per sailing ↓
- produced, not eaten ↓
- late order changes ↓
The deck plan shows which decks are busy on sea days and which on port days. Yellow marks the fruit left over in the store and the eggs the galley cooked for nobody.
One decision · CruiseCommerce · Fresh order for voyage 12
- 14:00
Provisions office, the day before turnaround · Provisioning officerProposed
CruiseCommerce proposes a fruit and dairy order for voyage 12 that sticks to the forecast and keeps a smaller buffer. On the last six similar voyages, fruit was still in the store at turnaround.
- 14:20
Approved 14:20
The provisioning officer approves the fruit and dairy lines.
- 16:00
Done
At cut-off, the fresh order goes to the supplier with the forecast quantities.
Decision: Voyage 12 · Provisions · Fruit order set to forecast · Approved 14:20
Other industries
Sources (2)
- 1Tallink Grupp, corporate factsheet, July 2026, key information for 2025. Restaurant and shop sales on board and ashore were 48% and tickets 29% of revenue of EUR 765 million. company.tallink.com
- 2Carnival Corporation & plc, annual report on Form 10-K for the financial year to 30 November 2025. Food cost USD 1,499 million and fuel USD 1,808 million; the food figure covers guests and crew but not drinks or retail goods. www.sec.gov